
Keyword
Earth Science | Biosphere | Aquatic Ecosystems | Pelagic Habitat
231 record(s)
Type of resources
Topics
Keywords
Contact for the resource
Provided by
Formats
Update frequencies
Status
draft
-
This dataset comprises the phytoplankton abundance and biovolume estimates as part of a broader sampling program carried out at the Southern Ocean Time Series, a facility within the Integrated Marine Observing System (IMOS). The primary focus is sustained observing of ocean properties and processes important to climate, carbon cycling, and ocean productivity. Regular phytoplankton samples are collected at approximately 14 day intervals (exact intervals and seasonal coverage dependent on deployment length). The moorings are serviced annually, at which time the existing moorings are recovered and new moorings are deployed. Water samples from within the surface mixed-layer are collected at pre-programmed intervals using a Remote Access Sampler, in pairs about 1 hour apart. One sample in each pair is preserved for phytoplankton community composition by microscopy, and the other sample is preserved and used for accompanying chemical analysis of nutrients, total dissolved inorganic carbon (DIC) and alkalinity. Each sample is collected from within the surface mixed-layer at 32 m depth (2010 - 2017) or 5 m depth (2018-current) depending on the design of the mooring surface assembly and instrumentation. Typically a maximum of 24 samples are collected over an annual deployment cycle. The samples collected are analysed for: 1. Community composition / abundance (cells/L) 2. calculated biovolume (um3/L). Protocols for the phytoplankton time-series are described in Eriksen et al (2018), and the annual sample reports for each deployment. Data storage and access is planned to be interoperable with other national and international programs through the IMOS Infrastructure. Station metadata can be found through this resource. Data is available freely via the AODN portal: https://portal.aodn.org.au. As the taxonomic resolution of the data has changed over time, due to continual training, it is important that users refer to the change log tables included in your data download. These will provide information on the validity of the taxa, from what date we have been identifying certain taxa etc. Classification fields may be blank depending on the level to which that taxa has been identified, i.e. if only identified to family, genus and species will be blank.
-

This resource describes a small sample of tag location and sensor information extracted from the CSIRO Tag Database. This consists of data from two tag deployments, which are presented in a format suitable for ingestion into the JPL Satellite-In situ Data Visualization Tool ("Coverage"). The data are presented as two projects, representing each tag deployment: Sample 01: CSIRO Southern Bluefin Tuna Tagging Program - Archival Tag Sample 01 - Sample data from a single Archival Tag (Wildlife Computers Mk7) deployed on a Southern Bluefin Tuna (T. maccoyii) in the Great Australian Bight (South Australia) on 25-Jan-1998. Sample 02: CSIRO White Shark Tagging Program - Satellite Tag Sample 02 - Sample data from a single Satellite Tag (Tag No: 06S0147, Wildlife Computers SPOT4) deployed on a White Shark (C. carcharias) in the Great Australian Bight (South Australia) on 29-Jun-2006. This resource is part of a broader tagging program, for more information please refer to the related parent study 'Pelagic Fish and Shark Tag Database'. A link can be found via the Online Resources. The position errors are estimates and are based on the data variability (Sample 01) or the Argos reported error codes (Sample 02). For Sample 01, the error estimate was calculated at three times the standard deviation, rounded up to the nearest 5km (5000m), and is typically in the order of 160km. The flag value '-9' is used where the position uncertainty is not reported. Positional data only were used for the White Shark, however a more complete set of data were extracted for the Southern Bluefin Tuna (SBT) - consisting of both positional information, and sensor information comprised of depth, internal and external temperature and light intensity. A 'windowing' function was applied across the data to generate a single consistent dataset, combining both data streams, with the sensor data cross-referencing the last recorded position. Additional checks and validations were applied at the data level, to ensure data quality. Sensor data was excluded where it was received more than 24 hours after a position update. The data are available in the Kaleidoscope spatial portal: https://kaleidoscope.terria.io/#share=s-2Xkn2gaP2rkZYJrpotMfF85Sslj Keywords: Tag, Southern Bluefin Tuna, SBT, White Shark.
-
The current National Marine Bioregionalisation project, coordinated by the Nation Oceans Office, consists of both pelagic (water column) and benthic (seafloor) components. The intended outcome of the National Marine Bioregionalisation is a set of bioregions for the Australian Marine Jurisdiction which will underpin a spatial framework to support planning and management of Australia's oceans. This report outlines the work on the pelagic regionalisation. The Pelagic Integration project aims to map and describe pelagic bioregions of the Australian Marine Jurisdiction (AMJ) with a particular focus on regions offshore of the continental shelf. Where possible it will complement the existing shelf pelagic bioregions of the Interim Marine and Coastal Regionalisation of Australia (IMCRA v3.3). In the process of the current regionalisation, we expect to produce datasets and analyses that may assist with a future update of the IMCRA pelagic bioregions and their descriptions. Hence, results of this project should not be extrapolated onto the continental shelf. CSIRO Marine Research has responsibility for the Pelagic Integration as part of its contribution to a Consortium (along with the National Oceans Office and Geosciences Australia (GA)) effort in the NMB integration projects.
-
The CSIRO O&A Catch Operations data set currently includes information on samples collected between 1965 and 2005 during voyages of various CSIRO research vessels. The data includes information about the time, location depth and catch method (trawl net etc) for each operation, metrics of catch (weight composition etc) and species and specimen details. Individual metadata records have been created for each research voyage. The data are held in the CSIRO Oceand and Atmosphere Data Warehouse, which currently holds over 13,000 catch operation records from more than 200 voyages.
-
NWSJEMS study outputs are accessed using this application which is normally distributed on DVD with the accompanying datasets. ViewNWS is a user interface and dataset which was designed for the presentation of environmental, social and economic data, the very factors that depict the state of an ecosystem as it evolves in response to natural forcing and human use. There are several ViewNWS Management Strategy Evaluation (MSE) displays which include maps, digital images and time series data. The software is written in Visual Basic and uses ESRI Map Objects for the spatial component.
-
This dataset stores information on the diet of pelagic fishes (tuna and swordfish). The samples and data have been collected seasonally from various sources (fishers on commercial, recreational and chartered vessels as well as CSIRO staff and observers) since 1992. Keywords: Stomach contents, diet, tuna, swordfish.
-
This record describes echosounder data collected on RV Investigator Event voyage IN2014_E03 which departed Hobart on the 10 Nov 2014 and returned to Hobart on the 17 Nov 2014. The Simrad ME70 echosounder was used to acquire water column data in from the East Coast of Tasmania. Data are stored in Simrad *.raw raw format at CSIRO Oceans and Atmosphere. There are 101 files totalling 9.45 GB of raw data in this dataset. Additional information regarding this dataset is contained in the GSM data acquisition and processing report.
-
This record describes echosounder data collected on RV Investigator voyage IN2014_E04 which departed Hobart on the 26 Nov 2014 and returned to Hobart on the 28 Nov 2014. The Simrad ME70 echosounder was used to acquire water column data in Storm Bay and east of Hobart. Data are stored in Simrad *.raw raw format at CSIRO Oceans and Atmosphere. There are 23 files totalling 20 GB of raw data in this dataset. Additional information regarding this dataset is contained in the GSM data acquisition and processing report.
-
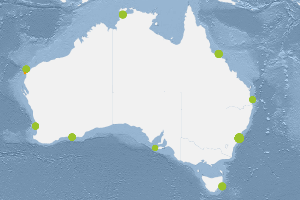
This dataset comprises the measurement of Secchi Depth and Total suspended solids (inorganic and organic components) analysed from samples collected as part of the Integrated Marine Observing Systems (IMOS) National Mooring Network -National Reference Station (NRS) field sampling. Nine Sites are included in the IMOS NRS field sampling stations. Maria Island (TAS), Kangaroo Island (SA), Esperance (WA), Rottnest Island (WA), Ningaloo (WA), Darwin (NT), Yongala (QLD), North Stradbroke Island (QLD) and Port Hacking 100 (NSW). Sampling at these sites is conducted by several members of IMOS NRS Biogeochemical project. Sampling at the sites began between 29/9/2008 and 8/11/2010 and is currently ongoing for 7 sites. Sampling ceased at Ningaloo and Esperance (WA) sites in Aug/Sept 2013. Sampling is conducted monthly (Esperance and Ningaloo were 3 monthly) off small vessels. Depths sampled range from surface to 105 metres depending on the site. Depths are usually sampled at 10 metre intervals. Details including information on station locations, depths sampled and sample types collected are shown in the PDF link below extracted from the IMOS NRS NATIONAL REFERENCE STATIONS BIOGEOCHEMICAL OPERATIONS - A PRACTICAL HANDBOOK, Version 2.2 July 2012. A link to the full handbook is also provided which includes full details of the sampling regime and analyses. Historical data collected as part of CSIRO Coastal Monitoring program is available for three of the National Reference Station sites: Maria Island Coastal Station Data 1944-2008, Port Hacking 100m Coastal Station Data 1953-2010 and Rottnest Island Coastal Station Data 1951-2009. The links to the metadata and access for these data is provided below. Data storage and access is planned to be interoperable with other national and international programs through the IMOS Infrastructure. Station metadata can be found through this resource. Data is available freely via the AODN portal: https://portal.aodn.org.au.
-
This dataset comprises the results of phytoplankton pigment composition analysed from samples collected as part of the Integrated Marine Observing Systems (IMOS) National Mooring Network - National Reference Station (NRS) field sampling. Pigment samples are taken for the complete water column (0-50m) and at the depths of the shallow WQM and the deeper WQM attached to the mooring at that site. Nine Sites are included in the IMOS NRS field sampling stations. Maria Island (TAS), Kangaroo Island (SA), Esperance (WA), Rottnest Island (WA), Ningaloo (WA), Darwin (NT), Yongala (QLD), North Stradbroke Island (QLD) and Port Hacking 100 (NSW). Sampling at these sites is conducted by several members of IMOS NRS Biogeochemical project. Sampling at the sites began between 29/9/2008 and 8/11/2010 and is currently ongoing for 7 sites. Sampling ceased at Ningaloo and Esperance (WA) sites in Aug/Sept 2013. Sampling is conducted monthly (Esperance and Ningaloo were 3 monthly) off small vessels. Depths sampled range from surface to 105 metres depending on the site. Depths are usually sampled at 10 metre intervals. Details including information on station locations, depths sampled and sample types collected are shown in the PDF link below extracted from the IMOS NRS NATIONAL REFERENCE STATIONS BIOGEOCHEMICAL OPERATIONS - A PRACTICAL HANDBOOK, Version 2.2 July 2012. A link to the full handbook is also provided which includes full details of the sampling regime and analyses. Historical data collected as part of CSIRO Coastal Monitoring program is available for three of the National Reference Station sites: Maria Island Coastal Station Data 1944-2008, Port Hacking 100m Coastal Station Data 1953-2010 and Rottnest Island Coastal Station Data 1951-2009. The links to the metadata and access for these data is provided below. Data storage and access is planned to be interoperable with other national and international programs through the IMOS Infrastructure. Station metadata can be found through this resource. Data is freely available through the AODN portal: https://portal.aodn.org.au